Confidence Interval
A confidence interval estimates an interval of a specific parameter that tells us something about the overall data space from which our dataset is a sample. In statistics the overall data space is called a population and our dataset is typically assumed to be derived from this population or represents a sample of this population. The estimation gives us a range of values (interval) that act as good estimates of the unknown data space or population parameter. Its usage is often in context of some evaluation of a model (e.g. linear regression, see example below). Especially in huge population sizes or big data spaces it makes sense to evaluate the model since the more data is available more noise in the data too.
It is provided as a range of values such that with, for example, 95% interval probability, the range will contain the unknown parameter. The range is defined in terms of lower and upper limits that are computed from the sample of our data. Standard errors can be used to compute confidence intervals while these errors are often obtained during a model fitting process (e.g. linear regression, see example below).
Confidence Interval R Example
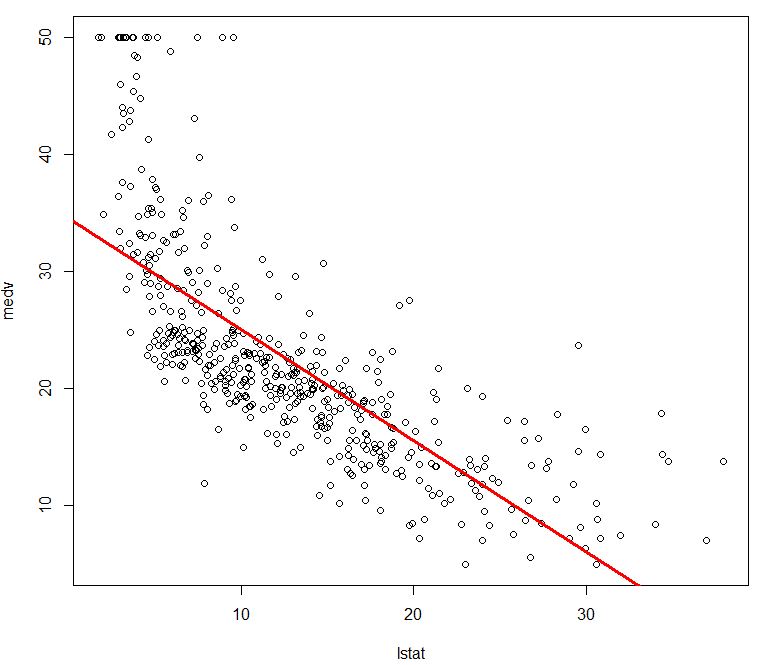
A confidence interval might be used to assess the accuracy of the coefficient estimates of a linear regression model. Please refer to our article ‘R Linear Regression’ in order to understand the basics of linear regression and a concrete application example that we visualize using R here:
> attach(Boston)
> plot(lstat,medv)
> abline (model.fit ,lwd =3, col =”red “)

Given that our regression model visualized as a red line above is stored in model.fit, we are able to obtain the confidence interval for its coefficient estimates. The following R command can be used to obtain the intervals:
> confint(model.fit)
Output:
                2.5 %     97.5 %
(Intercept) 33.448457 35.6592247
lstat       -1.026148 -0.8739505
In the case of the Boston data used in the example, the 95% confidence interval for medv is [33.448, 35.659] and the 95% confidence interval for lstat is [-1.026, -0.873]. Therefore, we can conclude that in the absence of any low socioeconomic percentage in neighborhoud (lstat, 0%), the median house prices will, on average, fall somewhere between 33,448 and 35,659 (unit $1000). Furthermore, for a decrease in socioeconomic percentage, there will be an average decrease in median house price of between -1.026 and -0.873.
More Information about a Confidence Interval
Please refer to the following short video about the topic:
Follow us on Facebook:


