PCA
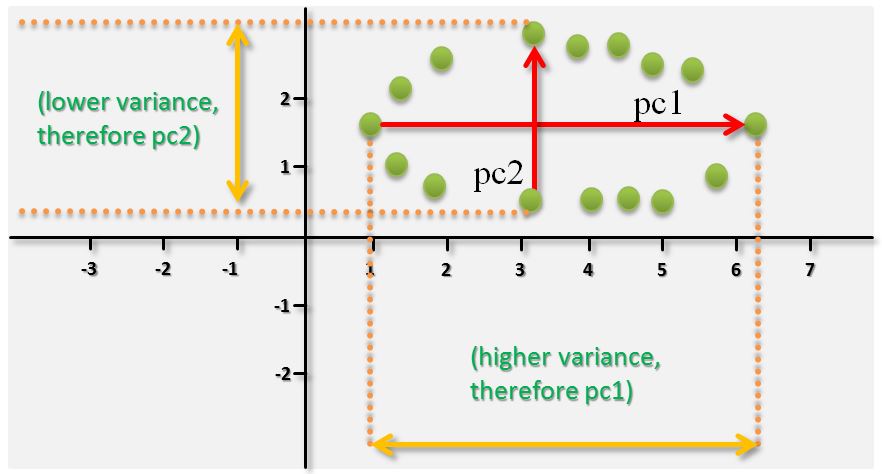
The Principal Component Analysis (PCA) is a feature engineering technique used with the given dataset before a machine learning algorithm is used or to visually explore the dataset. It emphasizes variation in the dataset and helps to identify strong patterns in a dataset more easier. This technique transforms the dataset in such a way that the first principal component has the largest possible variance. In other words the first principal component represents as much of the variability in the data as possible. The second principal component and other succeeding ones capture the highest variance possible again. But each succeeding component in turn needs to be orthogonal to the preceding principal component. The principal components thus represent the underlying structure in the data meaning the directions where is the most variance in the data. As shown in the simple two dimensional illustration below they indicate the direction where the data is most spread out. It some applications it is practically used for performing a dimensionality reduction that is quite useful for big data.

Understanding Variance of Data
It is important to understand the variance of data as it is the key to understand PCA. The variance of data measures how far a set of numbers is spread out. A variance of zero indicates that all the values are identical. A high variance indicates data Points that are very spread out around the mean and thus from each other. This is shown in the figure above when obtaining the first principal component ‘pc1’. A small variance indicates data points that are close to the mean and thus to each other. This is shown in the figure above when obtaining the second principal component ‘pc2’. As the variance is less than in the case of ‘pc1’, ‘pc2’ is set only as second principal component but orthogonal to the first principal component ‘pc1’.
More information about PCA
The following video provides a nice introduction to PCA:
Follow us on Facebook:


